


Physics Toolbox Sensor Suite
Vieyra Software
Perihal Physics Toolbox Sensor Suite
Bermanfaat bagi pendidikan STEM, Akademika, dan industry, Aplikasi ini menggunakan divais / perangkat input sensor untuk mengumpulkan, merekam dan mengekspor data dalam format csv (comma sevarated value) melalui file csv yang dapat disebarkan). Data dapat di plot terhadap waktu dalam bentuk grafik atau disajikan di layar secara digital) .Pengguna (user) dapat mengekspor data untuk dianalisis lebih lanjut dalam bentuk spreadsheet atau aplikasi lainnya. Aplikasi ini juga menghasilkan nada, warna, dan sebuah stroboskop. Untuk berbagai contoh penggunaan dalam STEM Education, silakan lihat di halaman berikut: www.vieyrasoftware.net.
Menu yang ada di aplikasi mengijinkan pengguna untuk merasakan atau menghasilkan ( Bergantung kepada kapabilitas dari telepon genggam pengguna):
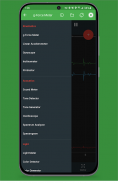
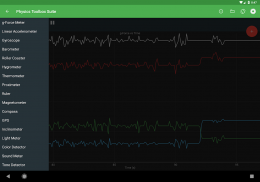
SENSORS
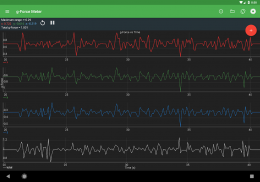
(1) G-Force Meter - ratio of Fn/Fg (x, y, z and/or total) – Alat ukur Gaya Gravitasi
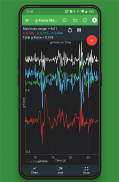
(2) Linear Accelerometer – acceleration (x, y, and/or z) – Alat ukur percepatan linear
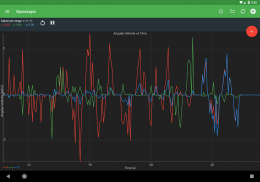
(3) Gyroscope - radial velocity (x, y, and/or z) – Giroskop – kecepatan radial
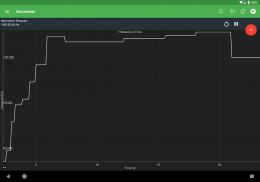
(4) Barometer - Alat ukur tekanan – tekanan atmosfer
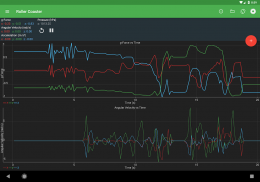
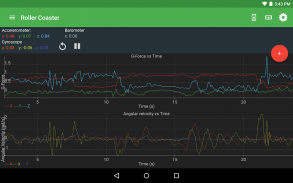
(5) Roller Coaster - G-Force Meter, Linear Accelerometer, Gyroscope, and Barometer
(6) Hygrometer - Alat ukur kelembaban
(7) Thermometer – temperature
(8) Proximeter – Gerak periodic dan pengukur waktu
(9) Ruler - Jarak antara dua titik
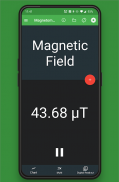
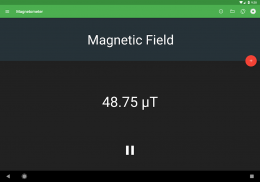
(10) Magnetometer – Intensitas medan magnet
(11) Compass - Arah medan magnet
(12) GPS - latitude, longitude, altitude, speed, direction, number of satellites
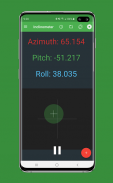
(13) Inclinometer - azimuth, roll, pitch
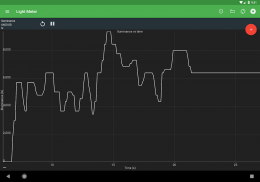
(14) Light Meter - lIntensitas Cahaya
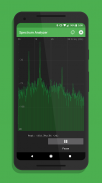
(15) Sound Meter - Intensitas Bunyi
(16) Tone Detector - frequency and musical tone – Frekuensi dan Nada musik
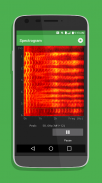
(17) Oscilloscope - wave shape and relative amplitude – Bentuk gelombang dan Amplitudo relatif
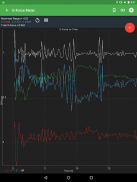
MULTI RECORD
(18) Multi Record – Perekam multi
GENERATORS
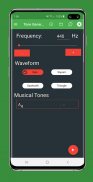
(19) Tone Generator – sound frequency producer – Pembangkit Frekuensi Bunyi
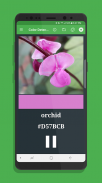
(20) Color Generator – R/G/B/Y/C/M, white, and custom color screen - R/G/B/Y/C/M, putih, dan pengaturan warna layar
(21) Stroboscope (beta) - camera flash
In multi record, users choose one or more of the above sensors to collect data at the same time – Dalam perekaman multi, untuk mengumpulkan data pada waktu yang sama, pengguna memilih salah satu sensor di atas atau lebih. Files can be easily named before export, or saved to the device's internal for easy organization and retrieval later on- File-file yang dihasilkan dapat dengan mudah dinamai sebelum diekspor atau disimpan ke divais internal agar mudah dalam mengorganisasikan juga dalam pencarian kembali.
Additional features include the ability to record data with clock time or elapsed time, select either the comma or semicolon as the csv delimiter, change line width on graphs, modify the relative sensor collection rate, and maintain the screen on at all times- Fitur-fitur tambahan dari aplikasi ini terdiri dari kemampuan untuk merekam data dengan waktu atau waktu yang telah berlalu, pemilihan koma atau titik koma dalam batasan data di csv, mengubah ketebalan garis pada grafik, memodifikasi laju pengumpulan pada sensor, dan memelihara layar setiap waktu.
Permissions Explained:
Location
Used to calculate the azimuth – Digunakan untuk menghitung azimut.
Photos/Media/Files
File csv dibuat dan dimodifikasi di memori internal telepon genggam.
Microphone
Aplikasi ini memiliki pengukur bunyi yang dapat menganalisis bunyi menggunakan mikrofon.
Physics Toolbox Sensor Suite - Versi 2025.07.10
(13-07-2025)
Physics Toolbox Sensor Suite - Maklumat APK
Versi APK: 2025.07.10Pakej: com.chrystianvieyra.physicstoolboxsuiteVersi Terkini Physics Toolbox Sensor Suite
Versi lain


 4.63
4.63


 4.15
4.15


Aplikasi dalam kategori sama


Anda juga mungkin suka...


